The problem
In the age of big data, some people still need to curate their data sets manually. In this post, I’m describing how to get the statistics for several manually chosen disjointed segments of some data in OriginLab’s Origin software.
The data in question looks like this:
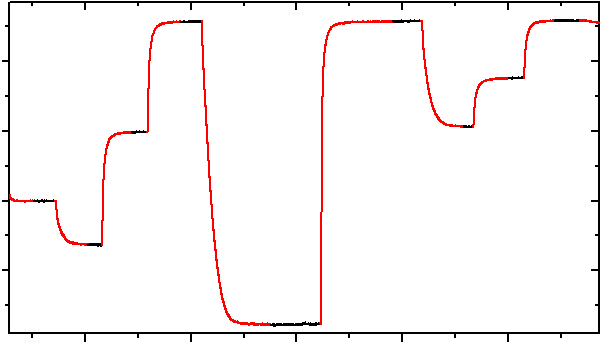
This is a relaxation curve, the kinds of which often result from some long-term experiments. The experiments differ (because, e.g., the samples are different) and unexpected things happen, so in this problem we’d like to choose the right data manually, not relying on the algorithms. Otherwise, we could just select the data based on, e.g., some critical value of the first derivative.
Since we only require the steady-state results, we’d like to obtain some statistics (in the simplest case, just the average values) from the parts of the curve that are black. In fact, the red parts of the curve - the ones we don’t need - are masked right there in the graph. One way of doing it is by masking everything and then using unmask on the segments we’re interested in. You can read here how to mask the data if you have no idea what I’m talking about.
If we try to calculate the statistics now (select the column in the worksheet - right click - Statistics on Column), we’ll get it sans the masked data, but everything will be combined and averaged, and we wanted to obtain separate results, one per each black segment.
The complication
The plot above has just one dependent data set, but what if there are several (i.e., several Y-data columns in the worksheet)? Remember: we (un)masked the data in the plot, which has only one Y-axis, so the mask is applied only to those data. Now we have to “distribute” the mask to the other columns of interest.
A real-life example of such problem would be a thermogravimetric experiment, where you vary the temperature and some external conditions (the sweeping gas composition, etc.) and watch for the mass change. In this case, the plot above would represent weight (Y) vs time (X) curve, and the second data column that we want to gather the statistics for as well would be the temperature (another Y).
The solution
As with any solution, this one might not be the most optimal, but it’s a working one.
What we did first was that we masked everything and unmasked the segments we need in the plot.
Second, we have to apply the mask to any other columns that we will calculate the statistics for. In order to do that, Set Column Values at the target column and paste the following into the Before Formula Scripts window:
//masks "toMask" column according to the mask in the "masked"
range toMask = Col(A);
range masked = Col(B);

int rStart = 1;
int rEnd = 1;
int rMasked = IsMasked(1, masked);
for (int i = 2; i <= masked.getSize(); i++) {
  if (IsMasked(i, masked) == rMasked) {
    rEnd++;
  } else {
    if (rMasked) {
      mark -w1 toMask[rStart:rEnd];
    } else {
      mark -wd toMask[rStart:rEnd];
    }
    rMasked = IsMasked(i, masked);
    rStart = i;
    rEnd = i;
  }
}
if (rMasked) {
  mark -w1 toMask[rStart:masked.getSize()];
} else {
  mark -wd toMask[rStart:masked.getSize()];
}
Don’t forget to change the range variables in the script for them to correspond to the actual data columns (toMask is our current column)! Voila, we’ve got our second column masked exactly as the first one.
The third step involves making a separate group column. That is, we have to create a column and populate it with the labels for each of the data range, so that Origin would know which data point corresponds to which range (or segment, or group). Go ahead and create a new column, and then paste this into Before Formula Scripts in Set Column Values:
//outputs "groups" column which enumerates ranges of adjacent unmasked cells
range data = Col(B);
range groups = Col(D);

int cntr = 0;
int previousWasMasked = 0;
for (int i = 1; i <= data.getSize(); i++) {
  if (!IsMasked(i, data)) {
    if (!previousWasMasked) {
      //new range
      cntr++;
      previousWasMasked = 1;
    }
    groups[i] = cntr;
  } else {
    previousWasMasked = 0;
    groups[i] = 0/0;
  }
}
Here, you’ll need to change the range variables as well - data is any of our masked data columns, and groups is the current, newly created one.
Finally, select the column(s), open Statistics on Column and add our group column to the Group list in the popup window. Then, set up the desired Quantities and stuff, and press OK. Congratulations! We’ve got the required separate descriptive statistics for several data ranges.
The last remark: for the really large data sets, you might want to turn off the automatic recalculations, so that any masking/unmasking action wouldn’t trigger the scripts to rerun, which might take a lot of time in this case.